This is an Open Access article distributed under the terms of the Creative Commons Attribution Non-Commercial License (http://creativecommons.org/licenses/by-nc/4.0/) which permits unrestricted non-commercial use, distribution, and reproduction in any medium, provided the original work is properly cited.
Although there is a genetic component to primary open-angle glaucoma (POAG) susceptibility, few studies have investigated interactions between genetic and environmental factors. We aimed to quantify the familial risk of POAG and estimate disease risk among individuals with a positive family history and either hypertension or hyperglycemia, as well as assess their interactions. Using the National Health Insurance database, which includes information on familial relationships and lifestyle risk factors, we identified 6,217,057 individuals with first-degree relatives (FDRs) from 2002-2018. We calculated familial risk using hazard ratios (HRs) with 95% confidence intervals (CIs) which compare the risk of individuals with and without affected FDRs. Disease risk was estimated among individuals with both a positive family history and hypertension or hyperglycemia, and interactions were assessed on an additive scale. Individuals with an affected parent had a 3.13-fold (95% CI 2.74–3.58) increased risk of disease compared to those with unaffected parents. Individuals with affected father, mother, or both affected parents showed HRs (95% CI) of 3.50 (2.86–4.30), 2.87 (2.41–3.44) and 4.88 (1.83–12.98), respectively. Familial risk adjusted for lifestyle factors decreased slightly (HR 3.14), suggesting that genetic component is the predominant driver in the familial aggregation. Individuals with a positive family history and either hypertension or hyperglycemia had a markedly elevated risk of disease, with HRs of 3.42 (95% CI 2.49–4.69) and 3.27 (95% CI 2.15–4.97), respectively. Hypertensive or hyperglycemic individuals with a positive family history may be considered a high-risk group and glaucoma screening may be considered.
Glaucoma is the second leading cause of irreversible blindness worldwide, with primary open-angle glaucoma (POAG) as its most common form [1]. Studies have reported that POAG affects approximately 2.2% of the global population over the age of 40 [2], with prevalence estimates ranging from 2.29% in Asian populations to 5.4% among people of African ancestry [3].
Genetic factors are known to play a role in the pathogenesis of POAG [4,5]. Studies have shown that the family members of glaucoma patients have up to a 10-fold increased risk of developing the disease [6]. Genetic studies have identified several genetic variants and single nucleotide polymorphisms (SNPs) that are associated with the development of POAG [7]. However, familial risk estimates from previous studies range from 3.1- [8] to 9.6-fold [6], showing a wide variation which may be attributable to heterogeneous study methodologies and sample sizes. Existing studies included up to a few hundred participants and may have yielded imprecise risk estimates due to limited statistical power and many used self-reported questionnaires or interviews in order to acquire information on family relationships or POAG diagnosis, which are susceptible to selective recall [9-11]. Most prior reports were case-control or cross-sectional studies that were unable to quantify incidence and risk ratios [6,8,11-14]. Two largescale population-based studies estimated the familial risk of POAG, however they used hospital discharge data which may not be representative of the general population [15,16]. Thus, a large-scale population-based study is needed in order to provide precise familial risk and incidence estimates for POAG, which could be useful for clinical risk counselling of families of patients.
A number of risk factors are associated with the development of POAG and accordingly, the familial aggregation of POAG may be influenced by both shared lifestyle factors in the family as well as genetic factors. However, their relative contributions in the familial aggregation of POAG is not well-studied. Hypertension [17-19] and diabetes [20,21] are established risk factors for POAG and have been shown to increase disease risk by approximately 1.50- and 1.40-fold, respectively. It is possible that the presence of these risk factors among genetically predisposed individuals yields a greater or lesser risk compared to non-genetically predisposed persons. These two factors may have an interactive relationship, in which the impact of risk factors is more sensitive towards individuals with a genetic predisposition. However, the risk of POAG associated with risk factors among individuals with a positive family history has not been clearly elucidated and studies on interactions between the two factors are limited. Epidemiologic studies at the population-level are currently unavailable.
Using the National Health Insurance (NHI) and the National Health Screening Program (NHSP) databases, which include information on family relationships and screening from the entire South Korean population, we aimed to estimate the familial risk of POAG and the combined risk of family history and hypertension/hyperglycemia. We also explored interactions between family history and these two factors in order to assess gene-environment interactions.
Methods
Data sources
In this study, we leveraged the NHI and NHSP databases in order to acquire information on all insured individuals and their dependents. The NHI is a government service that provides mandatory insurance to South Korea’s entire population of more than 50 million people. Both inpatient and outpatient healthcare utilization data are recorded in the NHI database, including disease diagnosis, prescriptions and procedures. Each medical facility submits this data to the NHI in order to receive reimbursement. The NHI database includes information on employment, enrollment and family relationships of beneficiaries and their dependents, and therefore we were able to identify parents and their offspring.
The NHSP is a health screening program that offers biennial health check-ups to beneficiaries and their dependents over the age of twenty, the results of which are then recorded in the NHI database. The examination includes a standardized questionnaire on participants’ medical history and lifestyle habits, such as smoking and alcohol consumption. Anthropometric measurements and basic tests are also taken at the check-up, including body mass index (BMI), systolic and diastolic blood pressure, creatine, liver enzymes, lipid parameters, chest radiograph, fasting blood sugar and hepatitis virus status.
Assessing family relationships
Employed or self-employed individuals can become NHI beneficiaries by paying a small percentage of their income. The spouse and children of beneficiaries are eligible to enrol in the program as dependents after the registration of either marriage or birth. This information allowed us to identify family relationships. An individual was considered the biological offspring of a married couple if they were registered at birth as a dependent.
Study population
Using the NHI and NHSP databases, we selected individuals with identifiable biological mother and father who underwent the standardized health checkup provided by the NHSP from January 1st, 2002 to December 31st, 2018. We excluded individuals who were diagnosed with POAG prior to the medical examination, as well as those with single parents or stepparents and children who were not registered as a dependent at birth. From this process, we constructed a cohort of 6,217,057 individuals, comprising 2.7 million families.
Assessment of risk factors
Blood samples are collected from the NHSP participants after overnight fasting to measure fasting blood sugar levels. We categorized individuals according to their fasting blood sugar levels. Individuals with a fasting blood glucose level below 100 mg/dl were categorized as ‘normoglycemic,’ those between 100 and 125 as ‘moderate,’ while those at or above 126 were categorized as ‘hyperglycemic.’
Blood pressure is measured three times on the same arm using an automatic sphygmomanometer, after a 10-minute rest period and the mean of the last two measurements calculated. Individuals were categorized according to their blood pressure in mmHg into 5 groups: (1) systolic blood pressure (SBP) <120 & diastolic blood pressure (DBP) <80; (2) SBP 120–129 & DBP <80; (3) SBP 130–139 or DBP 80–89; (4) SBP 140–180 or DBP 90–120; (5) SBP >180 & DBP >120. We also acquired information on other lifestyle characteristics of each study participant (see Supplementary text S1 for details).
Identification of POAG case diagnosis
We defined a POAG case as an individual who visited an outpatient clinic three times or more under the principal diagnosis of POAG (ICD-10 code H40.11) and who also underwent ophthalmoscopy, gonioscopy, visual field examination and measurement of central corneal thickness and intraocular pressure. To verify the diagnostic accuracy, we developed several algorithms based on the number of healthcare facility visits of POAG patients with ICD-10 code H40.11.
Statistical analysis
The study population was followed from January 1st, 2002 until a diagnosis of POAG, death, or the end of the follow-up period on December 31st, 2018, whichever came first. Individuals born after 2002 were followed since birth.
Once an individual was diagnosed with POAG during the follow-up period, their offspring were considered “exposed” and identified as “with an affected parent.” If a second parent became affected, they were defined as the “first familial case,” with the offspring identified as “with both affected parents.” In families with no affected parents, offspring were identified as “without affected parents,” and if the offspring developed POAG during follow-up, they were defined as “non-familial cases.”
We calculated person-years for each study subject, beginning from the index date of POAG diagnosis and ending at the corresponding end of follow-up. Study subjects contributed to person-years only when they were still at risk, i.e. alive and living in Korea without a diagnosis of POAG. The sum of person-years of all at-risk individuals was defined as total person-years. We calculated the incidence rate by dividing the number of POAG cases by the total person-years. Cox proportional hazard regression models were used to assess the magnitude of familial aggregation and estimate hazard ratios (HRs) with 95% confidence intervals (CIs) by comparing the risk of disease among people with versus without affected parents. HRs were calculated for each familial relationship. The proportional hazard assumption was tested by using the Schoenfeld assumption and scaled Schoenfeld residuals. In order to account for missing data on lifestyle factors, we excluded each missing value in the univariate analysis, while for the multivariate analysis, we replaced the missing data with the most frequent values in each column. We also imputed mean/median data and used multiple imputation, and as the results were similar for all three imputation methods, we chose imputation using the most frequent variables.
The association of environmental risk factors in POAG was examined by HRs with 95% CIs from Cox proportional hazards regression. The independent variables were blood pressure, BMI, fasting blood sugar, smoking status, alcohol use, total blood cholesterol, and proteinuria, and the dependent variable was the development of POAG. Familial risk before and after controlling for lifestyle factors was examined in order to determine the contribution of environmental factors on familial aggregation. Familial risk was first adjusted for age and sex by using a Cox model, which was thereafter adjusted again for lifestyle factors in another Cox model. We also assessed the association of environmental factors on the risk of POAG separately in familial and non-familial groups. Age- and sex-specific familial risks were calculated by comparing the incidences of POAG among individuals with and without affected parents in each age group and gender. Both age- and sex-specific familial risks were calculated for each familial relationship, namely affected father, mother, or both.
We calculated the combined risk of family history and hypertension/hyperglycemia and assessed interactions according to whether the combined risk was greater than the sum of their individual risks. Four disjoint categories, with each category coded as a dichotomous variable, were created for the combinations of family history and each lifestyle risk factor of POAG. HRs for family history (with versus without affected parents) and for hypertension or hyperglycemia (with versus without hypertension/hyperglycemia) were calculated separately. We calculated HRs of individuals exposed to both risks and the combined effect of two factors was compared to a reference group consisting of individuals without a positive family history nor hypertension/hyperglycemia. Based on the assumption that genetic and environmental factors are independent of one another in the underlying population, we investigated their interactions on an additive scale. The difference in HRs of family history and a given lifestyle factor was represented by relative excess risk due to interaction (RERI). RERI = 0 indicates that there is no interaction between two exposures, while any deviation suggests an interactive relationship.
We used Stata 15.0 in the execution of all statistical analyses. All statistical tests were two-sided and we considered a P-value of ≤ 0.05 as significant. This study was approved by the Korea University Institutional Review Board (IRB-2020-0310).
Results
Demographics of risk population and risk factors
Using the study database, we identified 6,217,057 individuals with biological mother and father who underwent the NHSP medical examination. During the 16-year study period, 64,522 patients developed POAG. 75,017 individuals (51,232 males and 23,785 females) had affected parents and 6,142,040 had unaffected parents. The demographic variables and lifestyle factors of individuals with and without affected parents are summarized in Table 1. With regards to the distribution of demographic variables, a higher proportion of males had affected parents and no significant differences were observed between the two groups in terms of blood pressure, BMI, blood sugar, smoking, alcohol consumption or cholesterol.
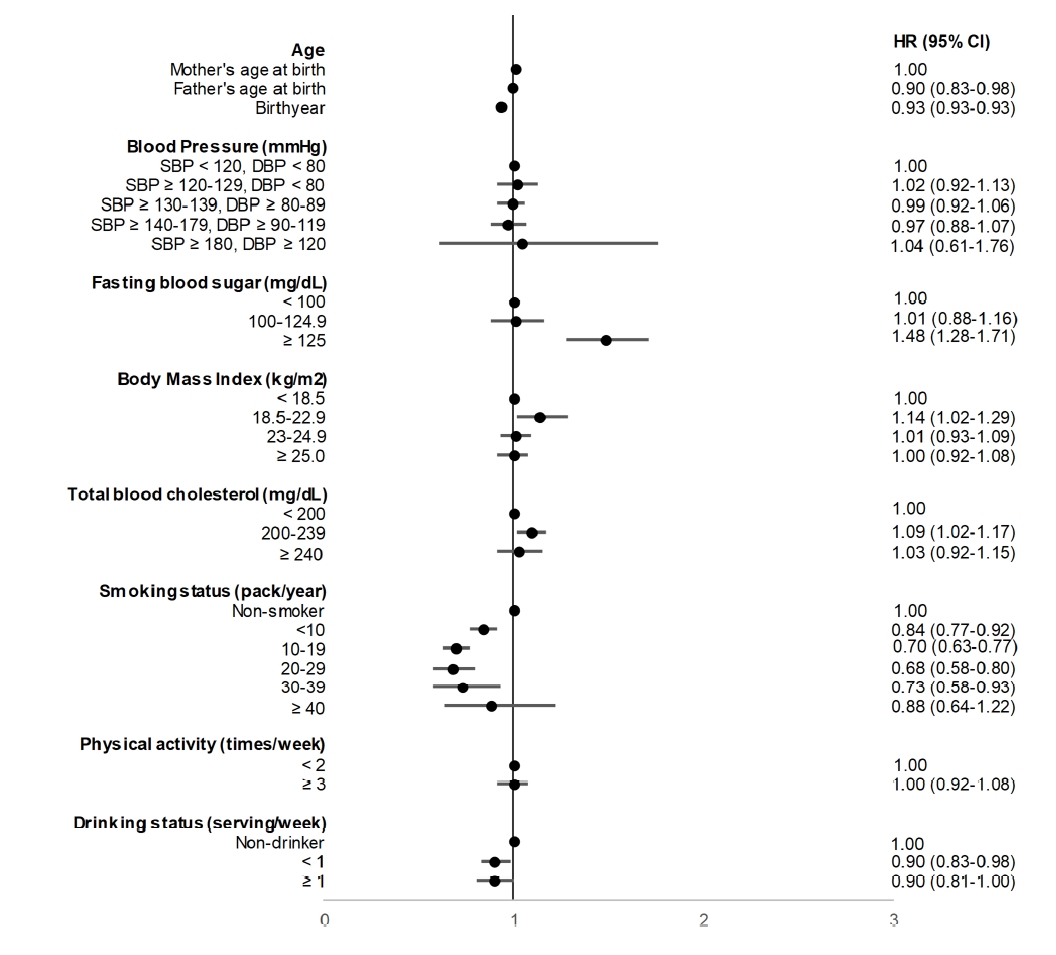
Fig. 1 shows the association between risk factors and POAG development in the entire study population. Overall, we found that hyperglycemia was associated with an increased risk of disease, with an HR of 1.48 (95% CI 1.28–1.71) for fasting blood sugar >126 (mg/dL), relative to fasting blood sugar <100 (mg/dL). Blood pressure, BMI, alcohol consumption and cholesterol were not significantly associated with disease development.
Familial risk analysis
Table 2 demonstrates that among individuals with affected parents, 225 cases developed POAG during the study period with an incidence of 1.88 (95% CI 1.65–2.15) per 10,000 person-years. Among individuals without affected parents, 4,297 cases developed POAG with an incidence of 0.44 (95% CI 0.43–0.45) per 10,000 person-years. The age- and sex-adjusted HR (95% CI) of developing POAG for individuals with versus without affected parents was 3.13 (95% CI 2.74–3.58). Risk was higher for individuals with affected father compared to mother, with corresponding HRs of 3.50 (95% CI 2.85–4.29) and 2.87 (95% CI 2.40–3.43). Individuals with both affected parents were at a very high risk of disease, with an HR of 4.88 (95% CI 1.83–13.00).
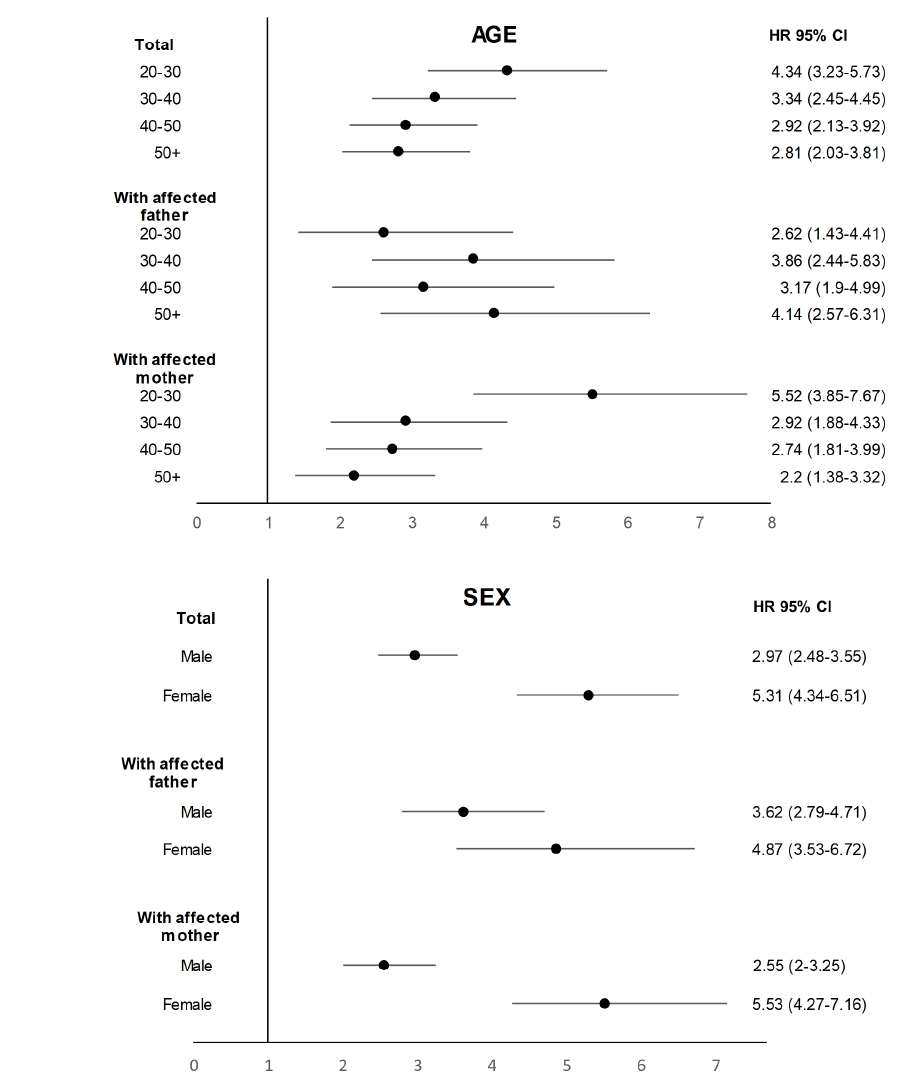
Age- and sex-specific familial risk
Fig. 2 displays the familial risk of POAG according to age groups and sex. We found that the familial risk was age-dependent, as the respective HRs for each age group decreased with advancing age. For individuals with affected mother, the HRs were 5.52 (95% CI 3.85–7.67) among the 20–30 year age group, 2.92 (95% CI 1.88–4.33) for the 30–40 year age group, and 2.20 (95% CI 1.38–3.32) among individuals older than 50 years. Similar trends were observed across age groups of individuals with affected father.
According to sex, females with an affected parent had a higher risk of disease compared to males, with HRs of 5.31 (95% CI 4.34–6.51) and 2.97 (95% CI 2.48–3.55), respectively. Females with an affected father or mother showed HRs of 4.87 (95% CI 3.53–6.72) and 5.53 (95% CI 4.27–7.16), respectively. Males with affected father or mother had HRs of 3.62 (95% CI 2.79–4.71) and 2.55 (95% CI 2.00–3.25), respectively.
Relative contribution of risk factors
The HR adjusted for risk factors increased slightly from 3.13 to 3.14 (95% CI 2.74–3.59), demonstrating that the attenuation was not significant and therefore the impact of lifestyle factors on the familial aggregation of POAG may be limited (Table 2). Familial risk according to family relationship similarly altered only slightly after the adjustment, with corresponding HRs of 3.51 (95% CI 2.86–4.30) for father and 2.88 (95% CI 2.41–3.44) for mother.
Evaluation of the combined effect of familial risk and hypertension/hyperglycemia
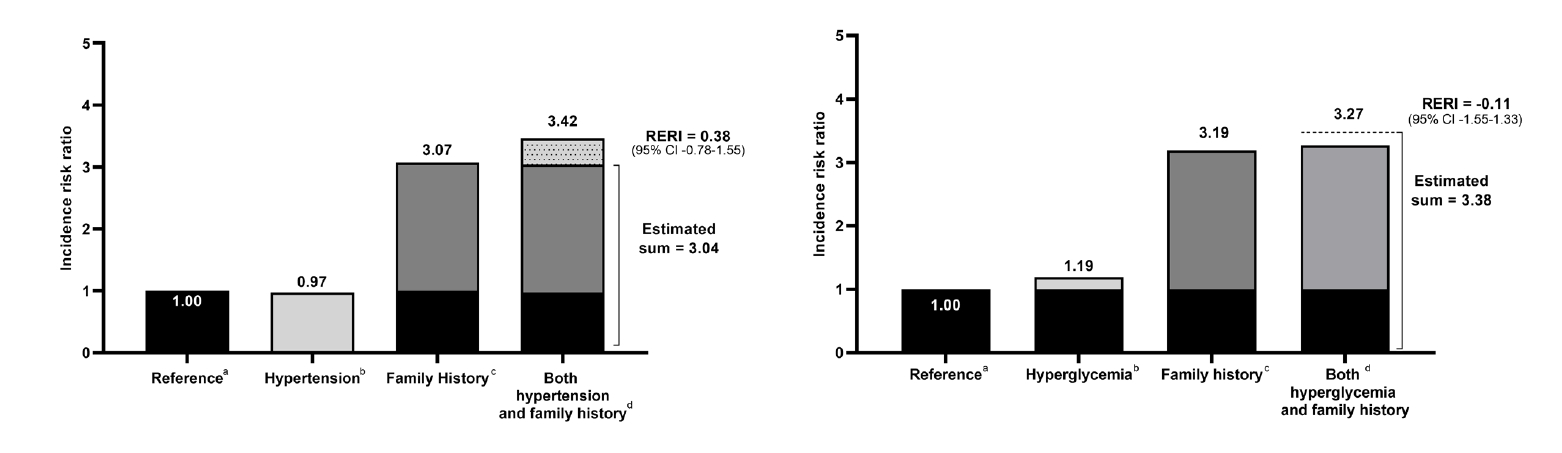
Our assessment of the combined risk of either hypertension or hyperglycemia and family history of POAG is presented in Fig. 3. Individuals with a positive family history and either hypertension or hyperglycemia had a markedly increased risk of POAG, with corresponding HRs of 3.42 (95% CI 2.49–4.69) and 3.27 (95% CI 2.15–4.97), respectively, compared to the general population. In the interaction analysis, the combined effect of a positive family history and hypertension was higher than the sum of their individual effects (HR 3.42 vs 3.04), but was statistically insignificant (RERI 0.38 95% CI–0.78 to–1.55). For hyperglycemia, its combined effect with a family history was similar to the sum of their individual effects (HR 3.27 vs 3.38), which was also statistically insignificant (RERI–-0.11 95% CI–1.55 to–1.33). The association of lifestyle factors was assessed separately among familial and non-familial groups (Table 3). The magnitude of the risk estimate for hypertension (SBP ≥ 180 or DBP ≥ 120) was higher in the familial compared to the non-familial group, with HRs of 2.36 (95% CI 0.32–17.30) and 0.99 (95% CI 0.57–1.71), respectively. For hyperglycemia, the magnitude of its effect was similar in the familial compared to non-familial group, with HRs of 1.48 (95% CI 0.77–2.84) and 1.48 (95% CI 1.27–1.72), respectively.
Discussion
Since the importance of hereditary glaucoma was first noted by von Graefe in 1869 [22], numerous studies have been conducted to investigate the familial risk of POAG. We identified a total of 24 studies that examined the familial aggregation of POAG, 13 of which systematically reported familial risk estimates, including case-control reports such as the Rotterdam study (n = 48; risk ratio (RR): 9.2, 95% CI, 1.2–73.9) [6], the Baltimore Eye Survey (n = 161; odds ratio (OR): 2.85, 1.82–4.46) [23], a prospective study from Shanghai (n = 113; OR 8.77, 3.73–20.62) [24], a French report (n = 175; OR 7.67, 3.25–18.1) [13] and a hospital-based Hong Kong study (n = 32; OR 20.2, 2.18–187) [25]. Population-based studies from Sweden [15] and Utah [16] estimated POAG familial risk as a standardized incidence ratio of 2.75 (95% CI 2.69–2.80) and RR of 6.25 (95% CI 3.94–9.90), respectively. Although the familial risk in our study is lower than these estimates, it should be taken into consideration that the risk estimates of case-control studies are often higher than cohort studies even though their cases and controls are similar. Moreover, these previous studies typically recruited participants from medical centres or hospitals [12,24,26], and consequently may have included more selective cases than in the general population. Existing population-based studies acquired data from hospital discharge databases, which may not be representative of the general population.
Cross-sectional studies from Melbourne (n = 187; OR 3.1, 95% CI 1.6–5.3) [8], Tasmania (n = 1,700; OR 4.1, 3.2–5.2) [12], Blue Mountains (n = 3,654; OR 3.2, 1.8–5.6) [27] and Harbin (n = 4,956; OR 14.58, 6.05–35.15) [28] have also investigated the familial aggregation of POAG. Additionally, cohort studies such as the Beaver Dam Eye Study (n = 5,924) [9] reported a heritability estimate of 0.36 for increased IOP, the Nottingham Family Glaucoma Screening Study (n = 271) [26] observed a sibling prevalence of 11.8% (95% CI 8.0%–15.7%) and the Barbados Eye Study (n = 3,222) [10] described an RR of 2.40 (1.30–4.60).
Three of these studies were strengthened by their use of ophthalmic exam to detect glaucoma among the family of patients [6,12,24]. However, several prior studies used questionnaires or interviews in acquiring information on family relationships and disease diagnosis [8,12,23], which may be prone to selective recall. We obtained information on family relationships from NHI beneficiary data and POAG cases were diagnosed by an ophthalmologist based on ICD-10 codes and most clinics use IOP measurements to accurately diagnose POAG. Moreover, most previous case-control and cohort studies included up to a few hundred or thousand participants, respectively, and therefore did not yield the statistical power necessary to calculate precise familial risk estimates. Our study, on the other hand, included six million individuals and provided the time-related HR as a familial risk estimate by following-up the FDR of POAG patients after their diagnosis, as well as POAG-unaffected FDR. It should also be taken into consideration that our study included the offspring of affected parents rather than siblings, who are known to have a higher risk of disease compared to parent-offspring relationships [23].
We observed age-dependence for familial risk of POAG, as higher HRs in younger age groups declined when age increased. In line with findings from other diseases, such early disease onset is characteristic of genetically predisposed diseases. It has been suggested that genetically determined disease features are more sensitive to environmental factors in adult-onset POAG due to disruption of normal physiologic homeostatic mechanisms [29].
The overall sex-specific familial risk of POAG was higher in females compared to males (HR 5.31 vs 2.97), though the background incidence was lower in females. We also found that according to family relationship, females with affected father and mother were at a higher risk than males. For the underlying mechanism, a genetic predisposition that is unique to women may be considered, which is supported by X-chromosome mediation of innate immune response and immune tolerance.
Our findings indicate that disease risk among hypertensive or hyperglycemic individuals with a positive family history is higher than the general population, and among persons with just one factor (i.e. with hypertension/hyperglycemia without a family history or vice versa). The combined effect of hypertension with a family history was higher than the sum of their individual effects, although this was statistically insignificant, and for hyperglycemia, its combined effect was similar to the sum of its individual effects. Our statistically non-significant results indicate that these factors may independently influence the development of POAG rather than potentiating each other. Our study suggests that individuals with a positive family history who are either hypertensive or hyperglycemic may be considered a high-risk group and should be advised to undergo genetic counseling. Glaucoma screening for these high-risk individuals may also be considered.
Genome-wide association studies have implicated up to 74 loci involved in the pathogenesis of POAG [30,31], such as CAV1/CAV2, CDKN2B-AS1, SIX1/SIX6, NTM and CNTNAP4 genes [32]. Well-established SNPs include those from CDKN2B-AS1, ATOH7, CDC7-TGFBR3 and TMCO1[31]. Although a limited number of gene-environment studies have been performed on POAG, a few studies have identified an interactive relationship between POAG-associated genes and lifestyle factors [33-37]. For instance, one genetic study found that TT homozygotes carriers for nitric oxide synthase 3 (NOS3) T-786C SNP with hypertension had an increased risk of disease compared to those without hypertension [17] and studies have reported evidence for a gene-environment interaction between glaucoma metabolism and type II diabetes mellitus [29].
It is possible that the genetic variants related to the biological pathways induced by hypertension and hyperglycemia are also engaged in the pathogenesis of POAG, such as lipid metabolism (ABCA1, CAV1/CAV2, ARHGEF12), cytokine signalling (CDKN2BAS, TGFBR2, FNDC3B), fucose and mannose metabolism (GMDs, PMM2), and oxidative stress/inflammation [38]. Future studies are needed to investigate the genes involved in hypertension/hyperglycemia in order to assess their potential interactions.
While our findings represent the ‘average’ effects of these POAG-related genes, genes may have a varying relationship with lifestyle factors and we cannot rule out the existence of interactions between specific genes and hypertension or hyperglycemia. Consequently, further gene-environment interaction studies are needed in order to assess the interactive relationship between POAG-related genes and hypertension and hyperglycemia, especially at the genome-wide level.
One limitation of our study is the use of administrative data, which may raise concerns regarding the validity of the POAG diagnosis. It is also possible that a number of cases were not included in our study, since POAG is a silent disease that is not diagnosed until screening or the onset of severe symptoms. However, because glaucoma screening using IOP measurement is widespread and easily accessible in South Korea, the number of undiagnosed cases missed by our study is likely to be low.
Conclusion
Our population-based study found a 3.13-fold increased familial risk of POAG and our findings suggest that genetic contribution is the predominant driver in the familial aggregation. Individuals with a positive family history and either hypertension or hyperglycemia should be considered a high-risk group and be considered for glaucoma screening.
Notes
Conflict of Interest
No potential conflict of interest relevant to this article was reported.
Funding
The authors received no specific funding for this work.
Data Availability Statement
The data that support the findings of this study are available from National Health Insurance but restrictions apply to the availability of these data, which were used under license for the current study, and so are not publicly available. Data are however available from the authors upon reasonable request and with permission of National Health Insurance.
This article is dedicated to the cherished memory of Hyeong Sik Ahn, whose passion for evidence-based medicine left an indelible mark on our understanding of familial risk. Although he is no longer with us, his work remains an enduring source of inspiration for our study and for public health improvement as a whole.
Association of risk factors with the study population.
N: number of individuals, SBP: systolic blood pressure, DBP: diastolic blood pressure, HR: hazard ratio, CI: confidence interval.
Fig. 2.
Familial risk of primary open-angle glaucoma accoriding to age and sex.
HR: hazard ratio, CI: confidence interval.
Fig. 3.
Separate and combined effects of family history and risk factors on the risk of primary open-angle glaucoma.
POAG: primary open-angle glaucoma, RERI: relative excess risk due to interaction. Lifestyle factors: hypertension, hyperglycemia.
aReference: persons without a family history of POAG or lifestyle factors.
bIndividual effect of a given lifestyle risk factor: persons with vs without hypertension or hyperglycemia.
cIndividual effect of family history: persons with vs without positive family history of POAG.
dCombined effect of family history and a given lifestyle risk factor: persons with both family history and either hypertension or hyperglycemia vs reference group.
Table 1.
Demographic Data of the Total Study Population and their Association with Lifestyle Risk Factors in Primary Open-Angle Glaucoma
With affected parents
Without affected parents
Standardized Difference
n
%
n
%
Total
75,017
100
6,142,040
100
Sex
Male
51,232
68.3
3,904,326
63.6
Female
23,785
31.7
2,237,714
36.4
0.10
Blood Pressure (mmHg)
SBP <120 & DBP <80
30,995
41.3
2,798,315
45.6
0.12
SBP 120–129 & DBP <80
8,548
11.4
731,753
11.9
SBP 130–139 or DBP 80–89
25,673
34.2
2,013,878
32.8
SBP 140–179 or DBP 90–119
9,624
12.8
587,151
9.6
SBP ≥ 180 & DBP ≥ 120
177
0.2
10,867
0.2
Fasting Blood Glucose (mg/dL)
<100
69,062
92.1
5,770,576
93.9
0.08
100–125
3,777
5.0
248,471
4.1
≥126
2,175
2.9
122,768
2.0
Body Mass Index (kg/m2)
<18.5
4,630
6.2
450,663
7.3
0.09
18.5–22.9
32,124
42.8
2,813,973
45.8
23.0–24.9
15,997
21.3
1,209,842
19.7
≥25.0
22,266
30.0
1,667,562
27.2
Cholesterol (mg/dL)
<200
48,899
65.2
4,243,115
69.1
0.16
200–239
19,082
25.4
1,329,630
21.7
≥240
5,853
7.8
361,982
5.9
Smoking (pack/year)
Non-smoker
39,454
52.6
3,346,815
54.5
0.20
<10
16,837
22.4
1,575,464
25.7
10–19
11,301
15.1
661,843
10.8
20–29
3,766
5.0
197,362
3.2
30–39
1,159
1.5
52,539
0.9
≥40
362
0.5
17,331
0.3
Physical activity
1–2/week
62,207
82.9
5,002,974
81.5
0.11
≥3/week
10,908
14.5
863,657
14.1
Alcohol consumption (drinks/week)
Non-drinker
26,311
35.1
2,039,222
33.2
0.18
<1
18,887
25.2
1,204,447
19.6
≥1
9,281
12.4
873,684
14.2
N: number of individuals, SBP: systolic blood pressure, DBP: diastolic blood pressure
Table 2.
Familial Risk of Primary Open-Angle Glaucoma among Offspring of Affected Parents
With affected parents
Without affected parents
Father
Mother
Both parents
Total
n
n
n
n
n
Number of people at risk
30,320
43,915
782
75,017
6,142,040
Male
20,324
30,351
557
51,232
3,904,326
Female
9,996
13,564
225
23,785
2,237,714
Number of cases
95
126
4
225
4,297
Person-years
483,092
699,709
12,391
1,195,192
98,061,108
Incidence/10,000 person-years (95% CI)
1.97 (1.61–2.40)
1.80 (1.51–2.14)
3.23 (1.21–8.60)
1.88 (1.65–2.15)
0.44 (0.43–0.45)
HRs (95% CI) adjusted for age and sex
3.50 (2.85–4.29)
2.87 (2.40–3.43)
4.88 (1.83–13.00)
3.13 (2.74–3.58)
1
HRs (95% CI) adjusted for age, sex, and lifestyle factors
3.51 (2.86–4.30)
2.88 (2.41–3.44)
4.87 (1.83–12.98)
3.14 (2.74–3.59)
1
N: number of individuals, HR: hazard ratio, Cl: confidence interval.
Table 3.
Lifestyle Risk Factor Analyses on Primary Open-Angle Glaucoma in Familial and Non-Familial Groups
2. Kapetanakis VV, Chan MP, Foster PJ, Cook DG, Owen CG, Rudnicka AR. Global variations and time trends in the prevalence of primary open angle glaucoma (POAG): a systematic review and meta-analysis. Br J Ophthalmol 2016; 100: 86-93.
3. Tham Y-C, Li X, Wong TY, Quigley HA, Aung T, Cheng C-Y. Global prevalence of glaucoma and projections of glaucoma burden through 2040: a systematic review and meta-analysis. Ophthalmology 2014; 121: 2081-90.
5. Mabuchi F, Sakurada Y, Kashiwagi K, Yamagata Z, Iijima H, Tsukahara S. Involvement of genetic variants associated with primary open-angle glaucoma in pathogenic mechanisms and family history of glaucoma. Am J Ophthalmol 2015; 159: 437-44. e2.
6. Wolfs RC, Klaver CC, Ramrattan RS, van Duijn CM, Hofman A, de Jong PT. Genetic risk of primary open-angle glaucoma: population-based familial aggregation study. Arch Ophthalmol 1998; 116: 1640-5.
7. Janssen SF, Gorgels TG, Ramdas WD, Klaver CC, van Duijn CM, Jansonius NM, et al. The vast complexity of primary open angle glaucoma: disease genes, risks, molecular mechanisms and pathobiology. Prog Retin Eye Res 2013; 37: 31-67.
8. Weih LM, Nanjan M, McCarty CA, Taylor HR. Prevalence and predictors of open-angle glaucoma: results from the visual impairment project. Ophthalmology 2001; 108: 1966-72.
9. Klein BE, Klein R, Lee KE. Heritability of risk factors for primary open-angle glaucoma: the Beaver Dam Eye Study. Invest Ophthalmol Vis Sci 2004; 45: 59-62.
12. Green CM, Kearns LS, Wu J, Barbour JM, Wilkinson RM, Ring MA, et al. How significant is a family history of glaucoma? Experience from the Glaucoma Inheritance Study in Tasmania. Clin Exp Ophthalmol 2007; 35: 793-9.
14. Gottfredsdottir MS, Sverrisson T, Musch DC, Stefansson E. Chronic open-angle glaucoma and associated ophthalmic findings in monozygotic twins and their spouses in Iceland. J Glaucoma 1999; 8: 134-9.
16. Wang X, Harmon J, Zabrieskie N, Chen Y, Grob S, Williams B, et al. Using the Utah Population Database to assess familial risk of primary open angle glaucoma. Vision Res 2010; 50: 2391-5.
18. Rim TH, Lee SY, Kim SH, Kim SS, Kim CY. Increased incidence of open-angle glaucoma among hypertensive patients: an 11-year nationwide retrospective cohort study. J Hypertens 2017; 35: 729-36.
19. Lin HC, Chien CW, Hu CC, Ho JD. Comparison of comorbid conditions between open-angle glaucoma patients and a control cohort: a case-control study. Ophthalmology 2010; 117: 2088-95.
20. Zhou M, Wang W, Huang W, Zhang X. Diabetes mellitus as a risk factor for open-angle glaucoma: a systematic review and meta-analysis. PloS one 2014; 9: e102972.
21. Pasquale LR, Kang JH, Manson JE, Willett WC, Rosner BA, Hankinson SE. Prospective study of type 2 diabetes mellitus and risk of primary open-angle glaucoma in women. Ophthalmology 2006; 113: 1081-6.
23. Tielsch JM, Katz J, Sommer A, Quigley HA, Javitt JC. Family history and risk of primary open angle glaucoma: the Baltimore Eye Survey. Arch Ophthalmol 1994; 112: 69-73.
25. Fan BJ, Leung YF, Wang N, Lam SC, Liu Y, Tam OS, et al. Genetic and environmental risk factors for primary open-angle glaucoma. Chin Med J (Engl) 2004; 117: 706-10.
26. Sung V, Koppens J, Vernon S, Pawson P, Rubinstein M, King A, et al. Longitudinal glaucoma screening for siblings of patients with primary open angle glaucoma: the Nottingham Family Glaucoma Screening Study. Br J Ophthalmol 2006; 90: 59-63.
27. Mitchell P, Rochtchina E, Lee AJ, Wang JJ. Bias in self-reported family history and relationship to glaucoma: the Blue Mountains Eye Study. Ophthalmic Epidemiol 2002; 9: 333-45.
28. Sun J, Zhou X, Kang Y, Yan L, Sun X, Sui H, et al. Prevalence and risk factors for primary open-angle glaucoma in a rural northeast China population: a population-based survey in Bin County, Harbin. Eye (Lond) 2012; 26: 283-91.
30. MacGregor S, Ong JS, An J, Han X, Zhou T, Siggs OM, et al. Genome-wide association study of intraocular pressure uncovers new pathways to glaucoma. Nat Genet 2018; 50: 1067-71.
31. Kim YW, Lee YH, Kim JS, Lee J, Kim YJ, Cheong HS, et al. Genetic analysis of primary open-angle glaucoma-related risk alleles in a Korean population: the GLAU-GENDISK study. Br J Ophthalmol 2021; 105: 1307-12.
32. Chen M, Yu X, Xu J, Ma J, Chen X, Chen B, et al. Association of Gene Polymorphisms With Primary Open Angle Glaucoma: A Systematic Review and Meta-Analysis. Invest Ophthalmol Vis Sci 2019; 60: 1105-21.
33. Thorleifsson G, Walters GB, Hewitt AW, Masson G, Helgason A, DeWan A, et al. Common variants near CAV1 and CAV2 are associated with primary open-angle glaucoma. Nat Genet 2010; 42: 906-9.
34. Burdon KP, Macgregor S, Hewitt AW, Sharma S, Chidlow G, Mills RA, et al. Genome-wide association study identifies susceptibility loci for open angle glaucoma at TMCO1 and CDKN2B-AS1. Nat Genet 2011; 43: 574-8.
35. Wiggs JL, Yaspan BL, Hauser MA, Kang JH, Allingham RR, Olson LM, et al. Common variants at 9p21 and 8q22 are associated with increased susceptibility to optic nerve degeneration in glaucoma. PLoS Genet 2012; 8: e1002654.
Familial risk and interaction with hypertension and hyperglycemia in primary open-angle glaucoma
Fig. 1. Association of risk factors with the study population.N: number of individuals, SBP: systolic blood pressure, DBP: diastolic blood pressure, HR: hazard ratio, CI: confidence interval.
Fig. 2. Familial risk of primary open-angle glaucoma accoriding to age and sex.HR: hazard ratio, CI: confidence interval.
Fig. 3. Separate and combined effects of family history and risk factors on the risk of primary open-angle glaucoma.POAG: primary open-angle glaucoma, RERI: relative excess risk due to interaction. Lifestyle factors: hypertension, hyperglycemia.
aReference: persons without a family history of POAG or lifestyle factors.
bIndividual effect of a given lifestyle risk factor: persons with vs without hypertension or hyperglycemia.
cIndividual effect of family history: persons with vs without positive family history of POAG.
dCombined effect of family history and a given lifestyle risk factor: persons with both family history and either hypertension or hyperglycemia vs reference group.
Fig. 1.
Fig. 2.
Fig. 3.
Familial risk and interaction with hypertension and hyperglycemia in primary open-angle glaucoma
With affected parents
Without affected parents
Standardized Difference
n
%
n
%
Total
75,017
100
6,142,040
100
Sex
Male
51,232
68.3
3,904,326
63.6
Female
23,785
31.7
2,237,714
36.4
0.10
Blood Pressure (mmHg)
SBP <120 & DBP <80
30,995
41.3
2,798,315
45.6
0.12
SBP 120–129 & DBP <80
8,548
11.4
731,753
11.9
SBP 130–139 or DBP 80–89
25,673
34.2
2,013,878
32.8
SBP 140–179 or DBP 90–119
9,624
12.8
587,151
9.6
SBP ≥ 180 & DBP ≥ 120
177
0.2
10,867
0.2
Fasting Blood Glucose (mg/dL)
<100
69,062
92.1
5,770,576
93.9
0.08
100–125
3,777
5.0
248,471
4.1
≥126
2,175
2.9
122,768
2.0
Body Mass Index (kg/m2)
<18.5
4,630
6.2
450,663
7.3
0.09
18.5–22.9
32,124
42.8
2,813,973
45.8
23.0–24.9
15,997
21.3
1,209,842
19.7
≥25.0
22,266
30.0
1,667,562
27.2
Cholesterol (mg/dL)
<200
48,899
65.2
4,243,115
69.1
0.16
200–239
19,082
25.4
1,329,630
21.7
≥240
5,853
7.8
361,982
5.9
Smoking (pack/year)
Non-smoker
39,454
52.6
3,346,815
54.5
0.20
<10
16,837
22.4
1,575,464
25.7
10–19
11,301
15.1
661,843
10.8
20–29
3,766
5.0
197,362
3.2
30–39
1,159
1.5
52,539
0.9
≥40
362
0.5
17,331
0.3
Physical activity
1–2/week
62,207
82.9
5,002,974
81.5
0.11
≥3/week
10,908
14.5
863,657
14.1
Alcohol consumption (drinks/week)
Non-drinker
26,311
35.1
2,039,222
33.2
0.18
<1
18,887
25.2
1,204,447
19.6
≥1
9,281
12.4
873,684
14.2
With affected parents
Without affected parents
Father
Mother
Both parents
Total
n
n
n
n
n
Number of people at risk
30,320
43,915
782
75,017
6,142,040
Male
20,324
30,351
557
51,232
3,904,326
Female
9,996
13,564
225
23,785
2,237,714
Number of cases
95
126
4
225
4,297
Person-years
483,092
699,709
12,391
1,195,192
98,061,108
Incidence/10,000 person-years (95% CI)
1.97 (1.61–2.40)
1.80 (1.51–2.14)
3.23 (1.21–8.60)
1.88 (1.65–2.15)
0.44 (0.43–0.45)
HRs (95% CI) adjusted for age and sex
3.50 (2.85–4.29)
2.87 (2.40–3.43)
4.88 (1.83–13.00)
3.13 (2.74–3.58)
1
HRs (95% CI) adjusted for age, sex, and lifestyle factors
3.51 (2.86–4.30)
2.88 (2.41–3.44)
4.87 (1.83–12.98)
3.14 (2.74–3.59)
1
Risk factors
With affected parents
Without affected parents
HR (95% CI)
HR (95% CI)
Blood pressure (mmHg)
SBP < 120 & DBP < 80 (reference)
1.00
1.00
SBP 120–129 & DBP < 80
1.00 (0.62–1.61)
1.02 (0.92–1.13)
SBP 130–139 or DBP 80–89
1.18 (0.85–1.63)
0.98 (0.91–1.05)
SBP 140–179 or DBP 90–119
1.51 (0.99–2.31)
0.95 (0.85–1.05)
SBP ≥ 180 or DBP ≥ 120
2.36 (0.32–17.3)
0.99 (0.57–1.71)
Fasting Blood sugar (mg/dL)
< 100 (reference)
1.00
1.00
100–125
1.05 (0.58–1.90)
1.01 (0.88–1.16)
≥126
1.48 (0.77–2.84)
1.48 (1.27–1.72)
Body mass Index (kg/m2)
< 18.5 (reference)
1.00
1.00
18.5–22.9
2.45 (1.58–3.82)
1.09 (0.97–1.23)
23–24.9
1.63 (1.13–2.33)
0.99 (0.91–1.07)
25
1.38 (0.96–1.98)
0.98 (0.91–1.06)
Total cholesterol (mg/dL)
< 200 (reference)
1.00
1.00
200–239
1.15 (0.85–1.55)
1.09 (1.01–1.17)
≥ 240
0.78 (0.45–1.35)
1.05 (0.93–1.17)
Smoking (pack/year)
Non-smoker (reference)
1.00
1.00
<10
1.04 (0.70–1.55)
0.83 (0.76–0.91)
10–19
0.78 (0.49–1.25)
0.69 (0.62–0.77)
20–29
0.87 (0.43–1.77)
0.67 (0.57–0.80)
30–39
0.73 (0.23–2.35)
0.74 (0.58–0.94)
≥40
-
0.91 (0.66-1.26)
Physical activity
<2 times/week (reference)
1.00
1.00
≥3 times/week
0.70 (0.46–1.08)
1.02 (0.93–1.10)
Alcohol consumption (drink/week)
Non-drinker (reference)
1.00
1.00
<1
0.96 (0.67–1.39)
0.90 (0.82–0.98)
≥1
0.32 (0.15–0.67)
0.93 (0.84–1.04)
Table 1. Demographic Data of the Total Study Population and their Association with Lifestyle Risk Factors in Primary Open-Angle Glaucoma
N: number of individuals, SBP: systolic blood pressure, DBP: diastolic blood pressure
Table 2. Familial Risk of Primary Open-Angle Glaucoma among Offspring of Affected Parents
N: number of individuals, HR: hazard ratio, Cl: confidence interval.
Table 3. Lifestyle Risk Factor Analyses on Primary Open-Angle Glaucoma in Familial and Non-Familial Groups


 , Heather Swan1,2